

Objective
The Pillar 2 team developed a monitoring schema for the assessment of soil-multifunctionality across Europe. This schema builds upon existing monitoring systems where possible and provides a set of indicators which collectively can be used to describe five agricultural soil functions. This is supported by a sampling design not only at European level but provides advice at national scale for the minimum number of sites required for national assessment.
Many indicators have been developed in the past which focus on threats to soil quality (Kibblewhite et al., 2008) but this terminology has proven difficult to communicate with farmers and land managers at the local scale (Schulte et al., 2014).
Therefore LANDMARK focuses on indicators that provide the end-user with an assessment of soil functionality instead of threats. The selection of indicators has been tested on existing datasets, as several of the project partners own large-scale databases with measurements of soil functions. The selection of these regional indicators is synchronous and harmonised with the selection of attributes and management practices included in the on-farm application developed in Pillar 1, and is being reviewed with the main stakeholders of this Pillar.
The regional indicators have been tested in Spring 2018 at 94 sites across Europe, based on soil types x land-use matrix for the major European climatic zones (Atlantic, Continental, Alpine, Mediterranean and Pannonian) (regional scale).
Who
The pillar is coordinated by Prof Rachel Creamer (Wageningen University).
Design of a monitoring schema (task 5.3)
Led by Prof Rachel Creamer (WUR2). The team consists of Dr Jeroen van Leeuwen (WUR 2 ), Henk Martens (WUR 2 ), Prof Cajo ter Braak ( WUR1), Prof Dick Brus (WUR 2 ).
In this task we are developing a monitoring schema for the range of soil functions associated with different soil types, land-uses and European major climatic zones (Alpine south, Atlantic North and Central, Continental, Mediterranean north and Pannonian) (regional scale).
This work started in July 2015 following the initial kick-off workshop in Teagasc, Ireland. The leader has been strongly involved in WP1 and WP2 the communication with stakeholders and database development, to ensure continuity with the work required.
In the WP3 workshop in Ljubljana in 2016, it was agreed that a logical sieve assessment (developed originally by Ritz et al. 2009 and used by Stone et al. for a similar exercise in 2015) would be performed by the expert task teams for the soil functions to evaluate which attributes contribute to the regulation of the five soil functions. The logical sieve was developed in conjunction with WP3 leaders to first ensure that the sieve not only evaluated the importance of an attribute to a particular soil function and in a second phase also meets the logistical requirements for method deployment in the field and laboratory as well as the development of standardized methods to date. This process allowed us to categorise the top 20 attributes associated with each soil function and select those attributes which were pivotal to more than one soil function. This provided the basis of the sampling schema for indicator selection and is a major component of the paper of Van Leeuwen et al. 2018 on Gap assessment in current soil monitoring networks across Europe for measuring soil functions. The team have communicated with all member states, where possible, to ask for details of existing monitoring programmes at a national scale. Representatives from twenty-eight countries were contacted and we received detailed information back from twelve countries.
We are now assessing if these attributes are truly indicative of the five soil functions and therefore of relevance to the final indicator selection for this Task. In addition, the spatial design of the sampling strategy is currently under review. However, it has been agreed with the EC JRC that the sampling schema should where possible be aligned to existing monitoring systems available in Europe. Such a system includes the EC LUCAS -SOIL monitoring schema, which samples approximately 20,000 sites across Europe in association with the Land Use and Cover Arial Survey (LUCAS). The sampling of these sites is currently focussed on chemical and physical soil properties in the topsoil. LANDMARK is working with JRC to optimise the use of the LUCAS survey to specifically include measures of /or which describe the regulation of the five soil functions.
Testing and evaluation of monitoring schema (task 5.4)
Led by Prof Rachel Creamer (WUR2). The sampling team consists of Dr Jeroen van Leeuwen (WUR 2 ), Marie Zwetsloot(WUR) Henk Martens (WUR 2 ), Ekatherina Vasquez Zambrano (WUR 2 ) and Dr Iolanda Simó (Smart Soil & Land).
In this task, we tested and validated the indicators (attributes) selected at 94 sites across Europe, based on a soil type x land-use matrix for the major climatic zones of Europe.
We utilised the Environmental Stratification of Europe in Environmental Zones by Metzger et al. (2005) and Jongman et al. (2006) as the basis for climatic zone selection. From this map, the following 6 climate zones have been identified for the testing and validation phase: Atlantic North, Atlantic Central, Continental, Alpine south, Mediterranean north and Pannonian. All of these climate zones have LANDMARK partners situated within them, to support and host the sampling team.
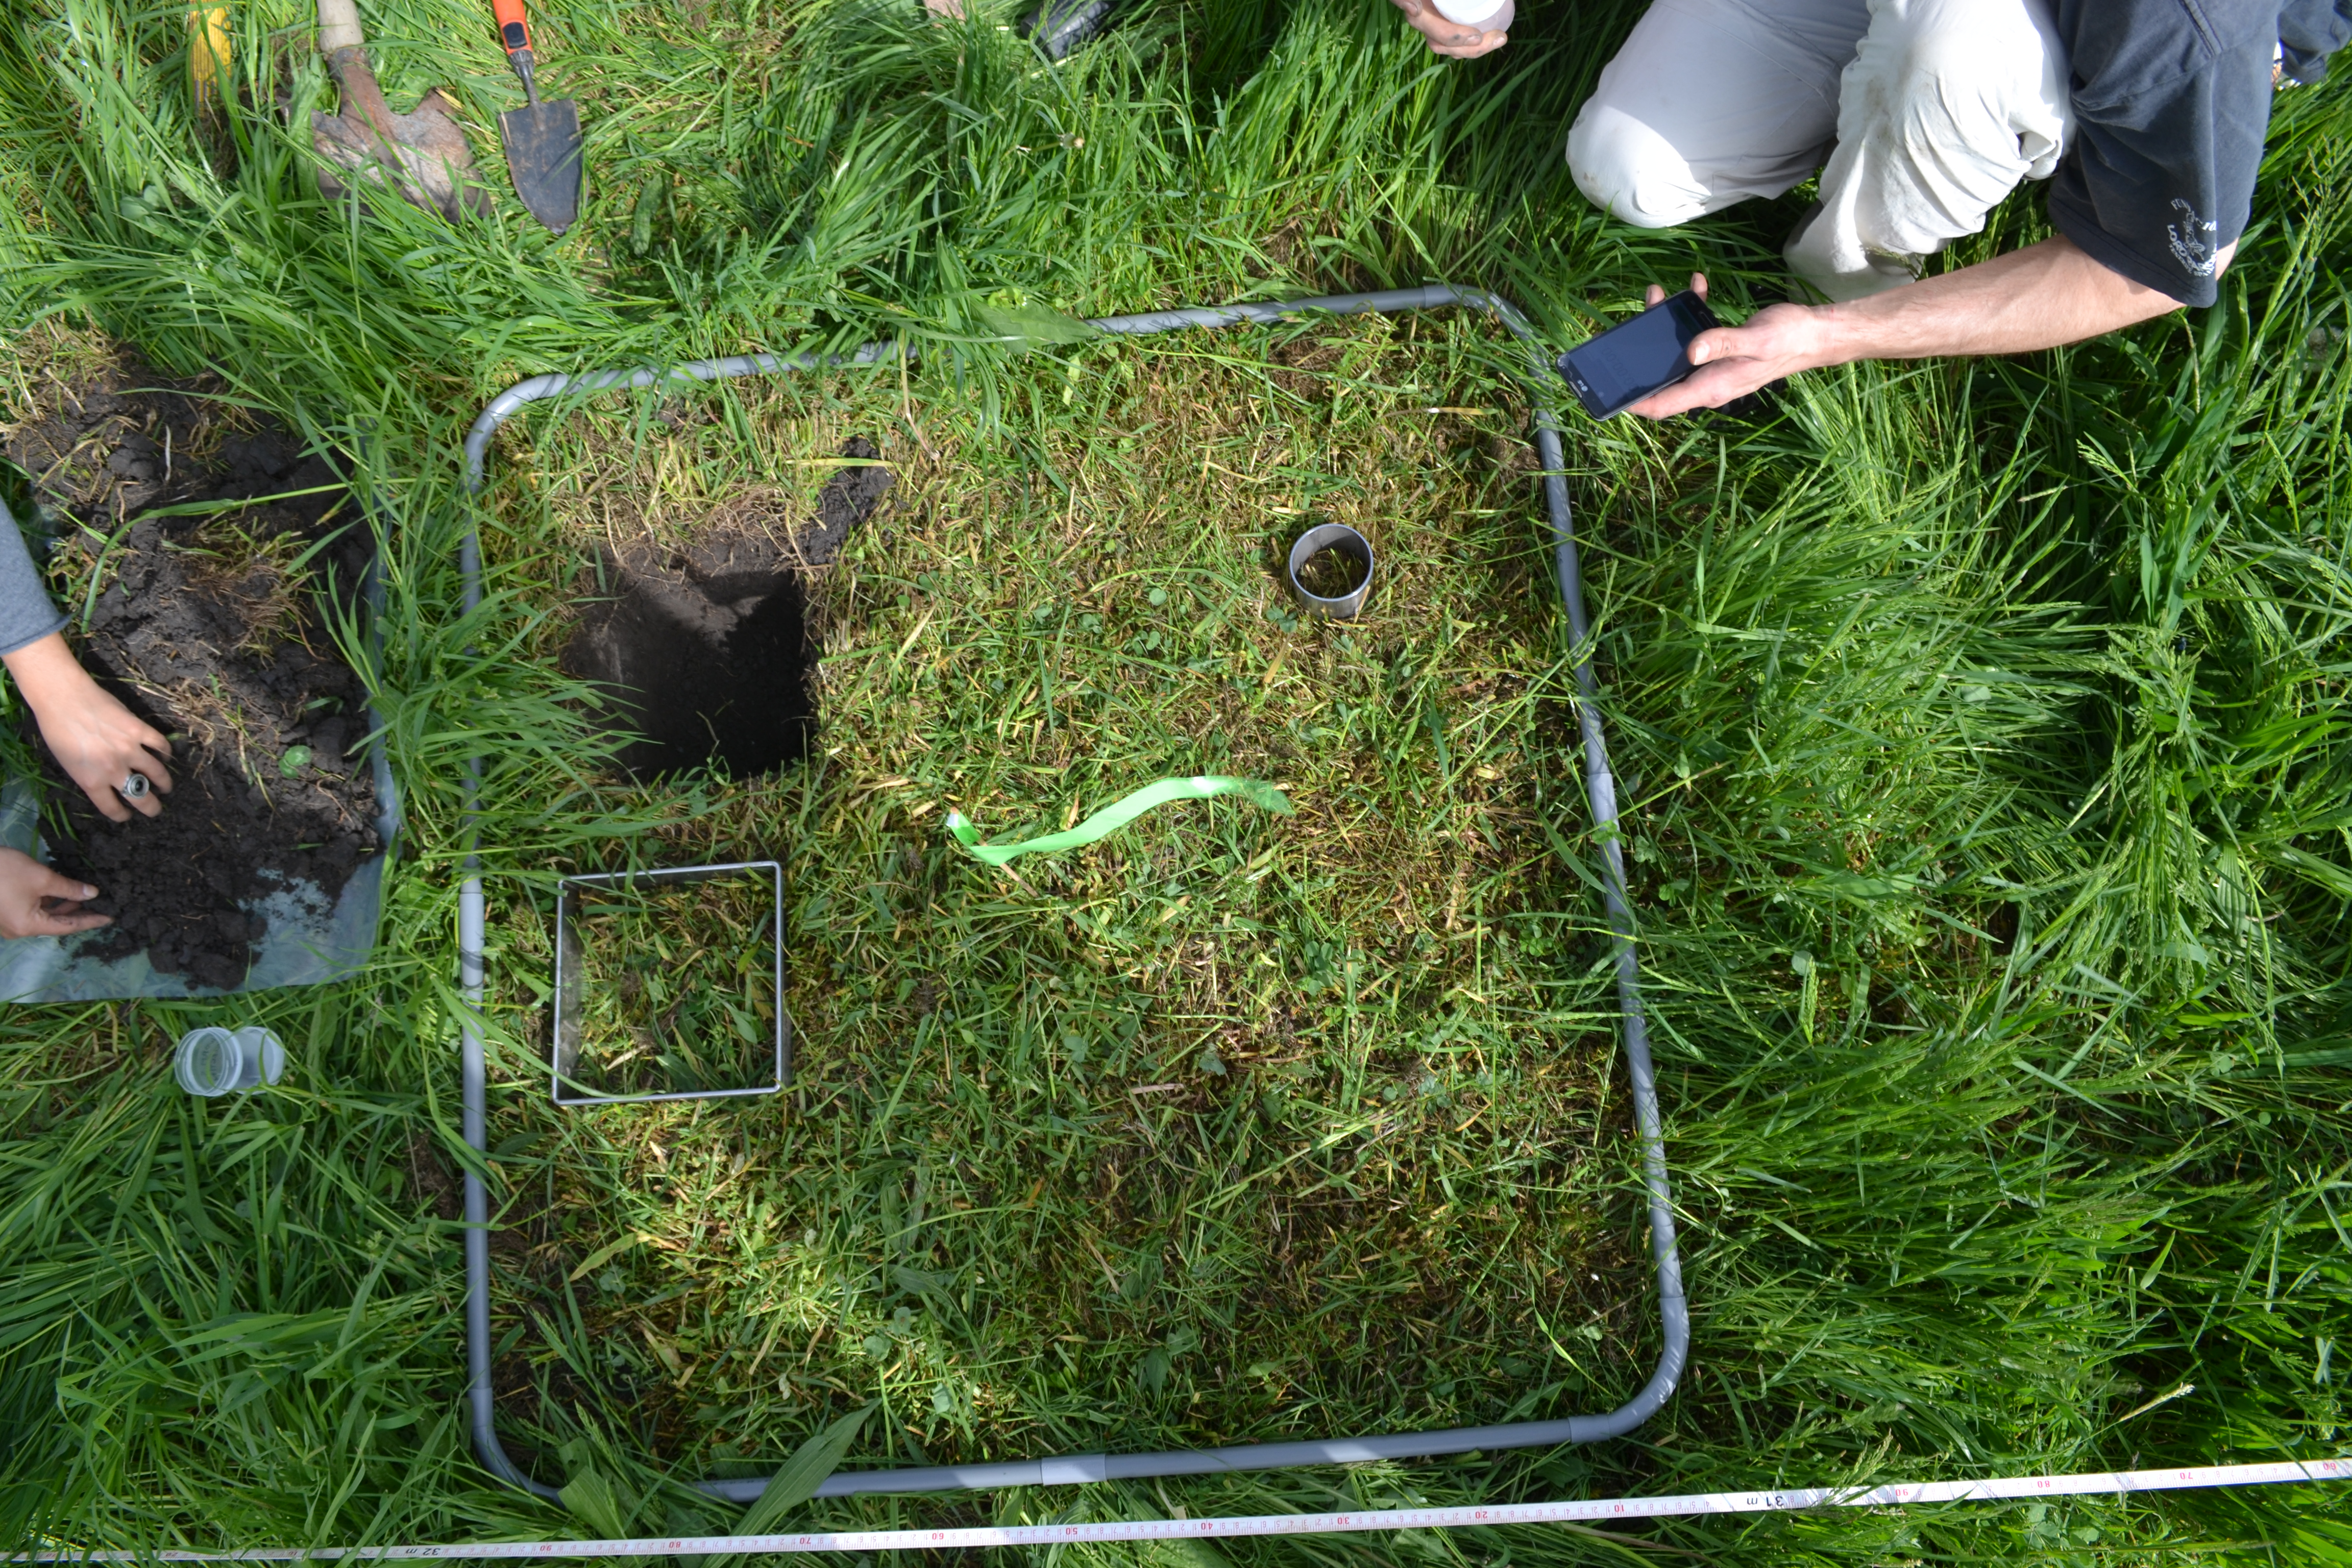
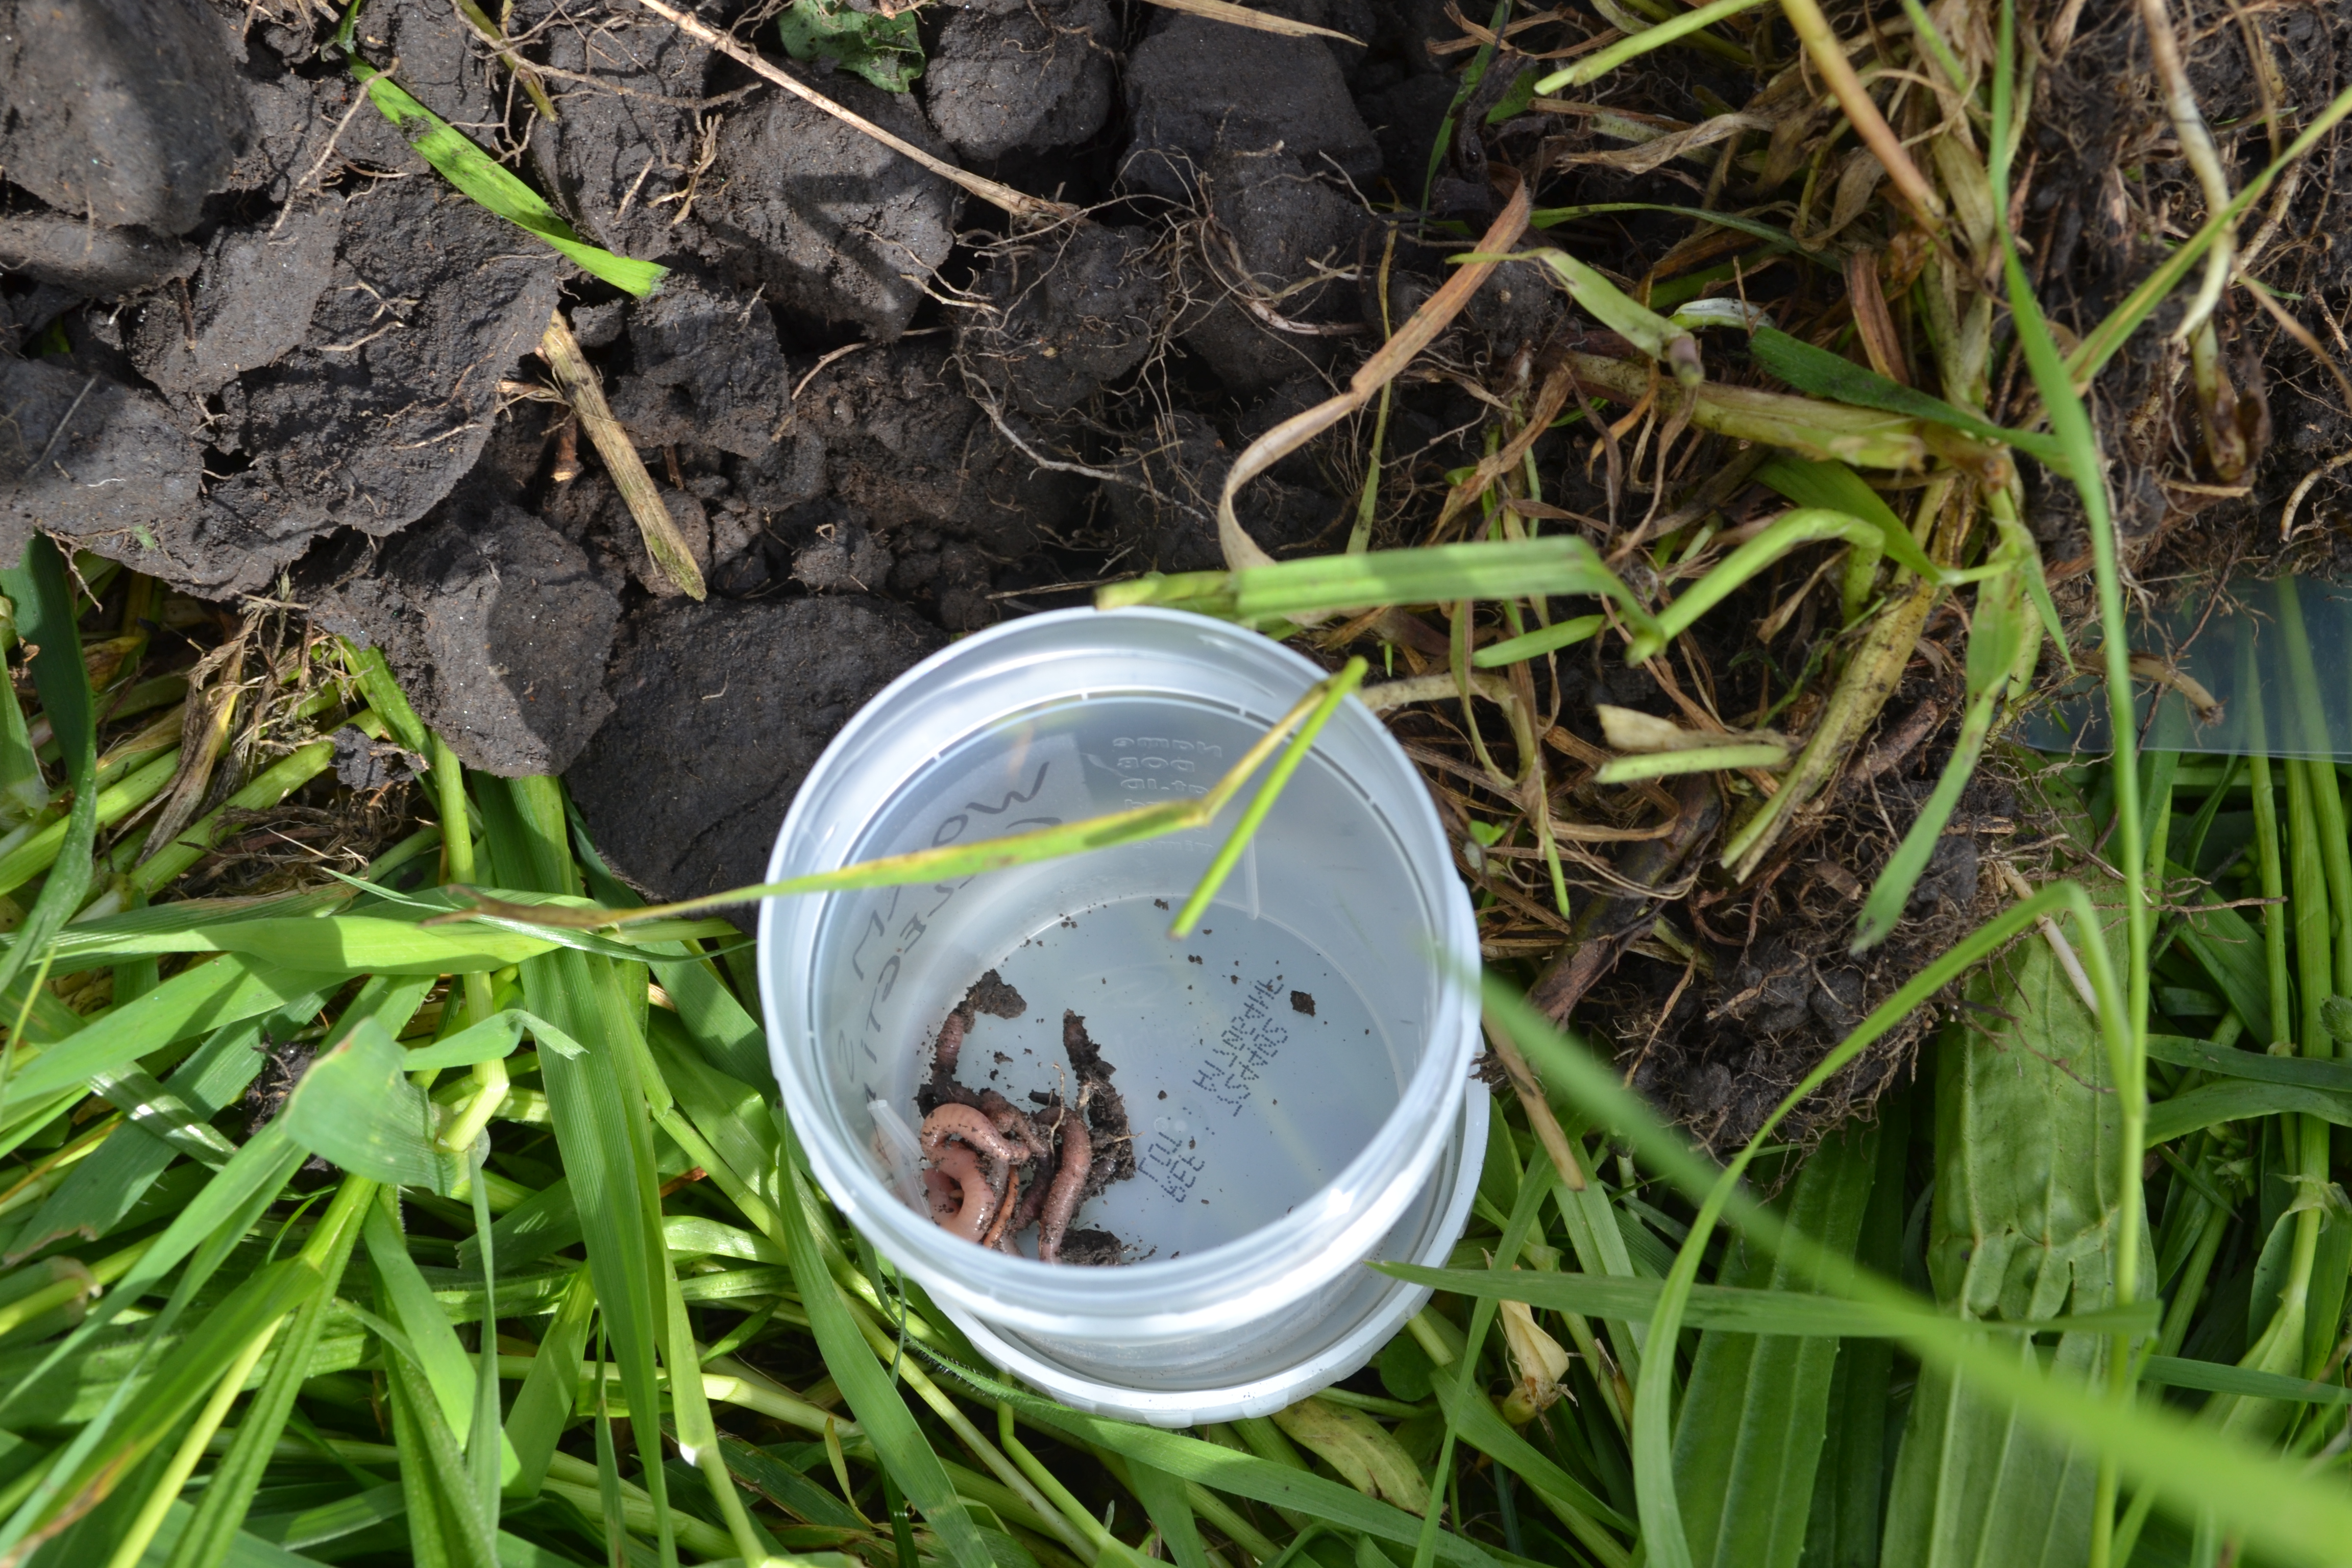
Example of sampling exercise at Site n1. Villadose di Rovigo, Italy.
| 1×1 m plot – 50x50x50cm pit
|
Earthworm abundance
|
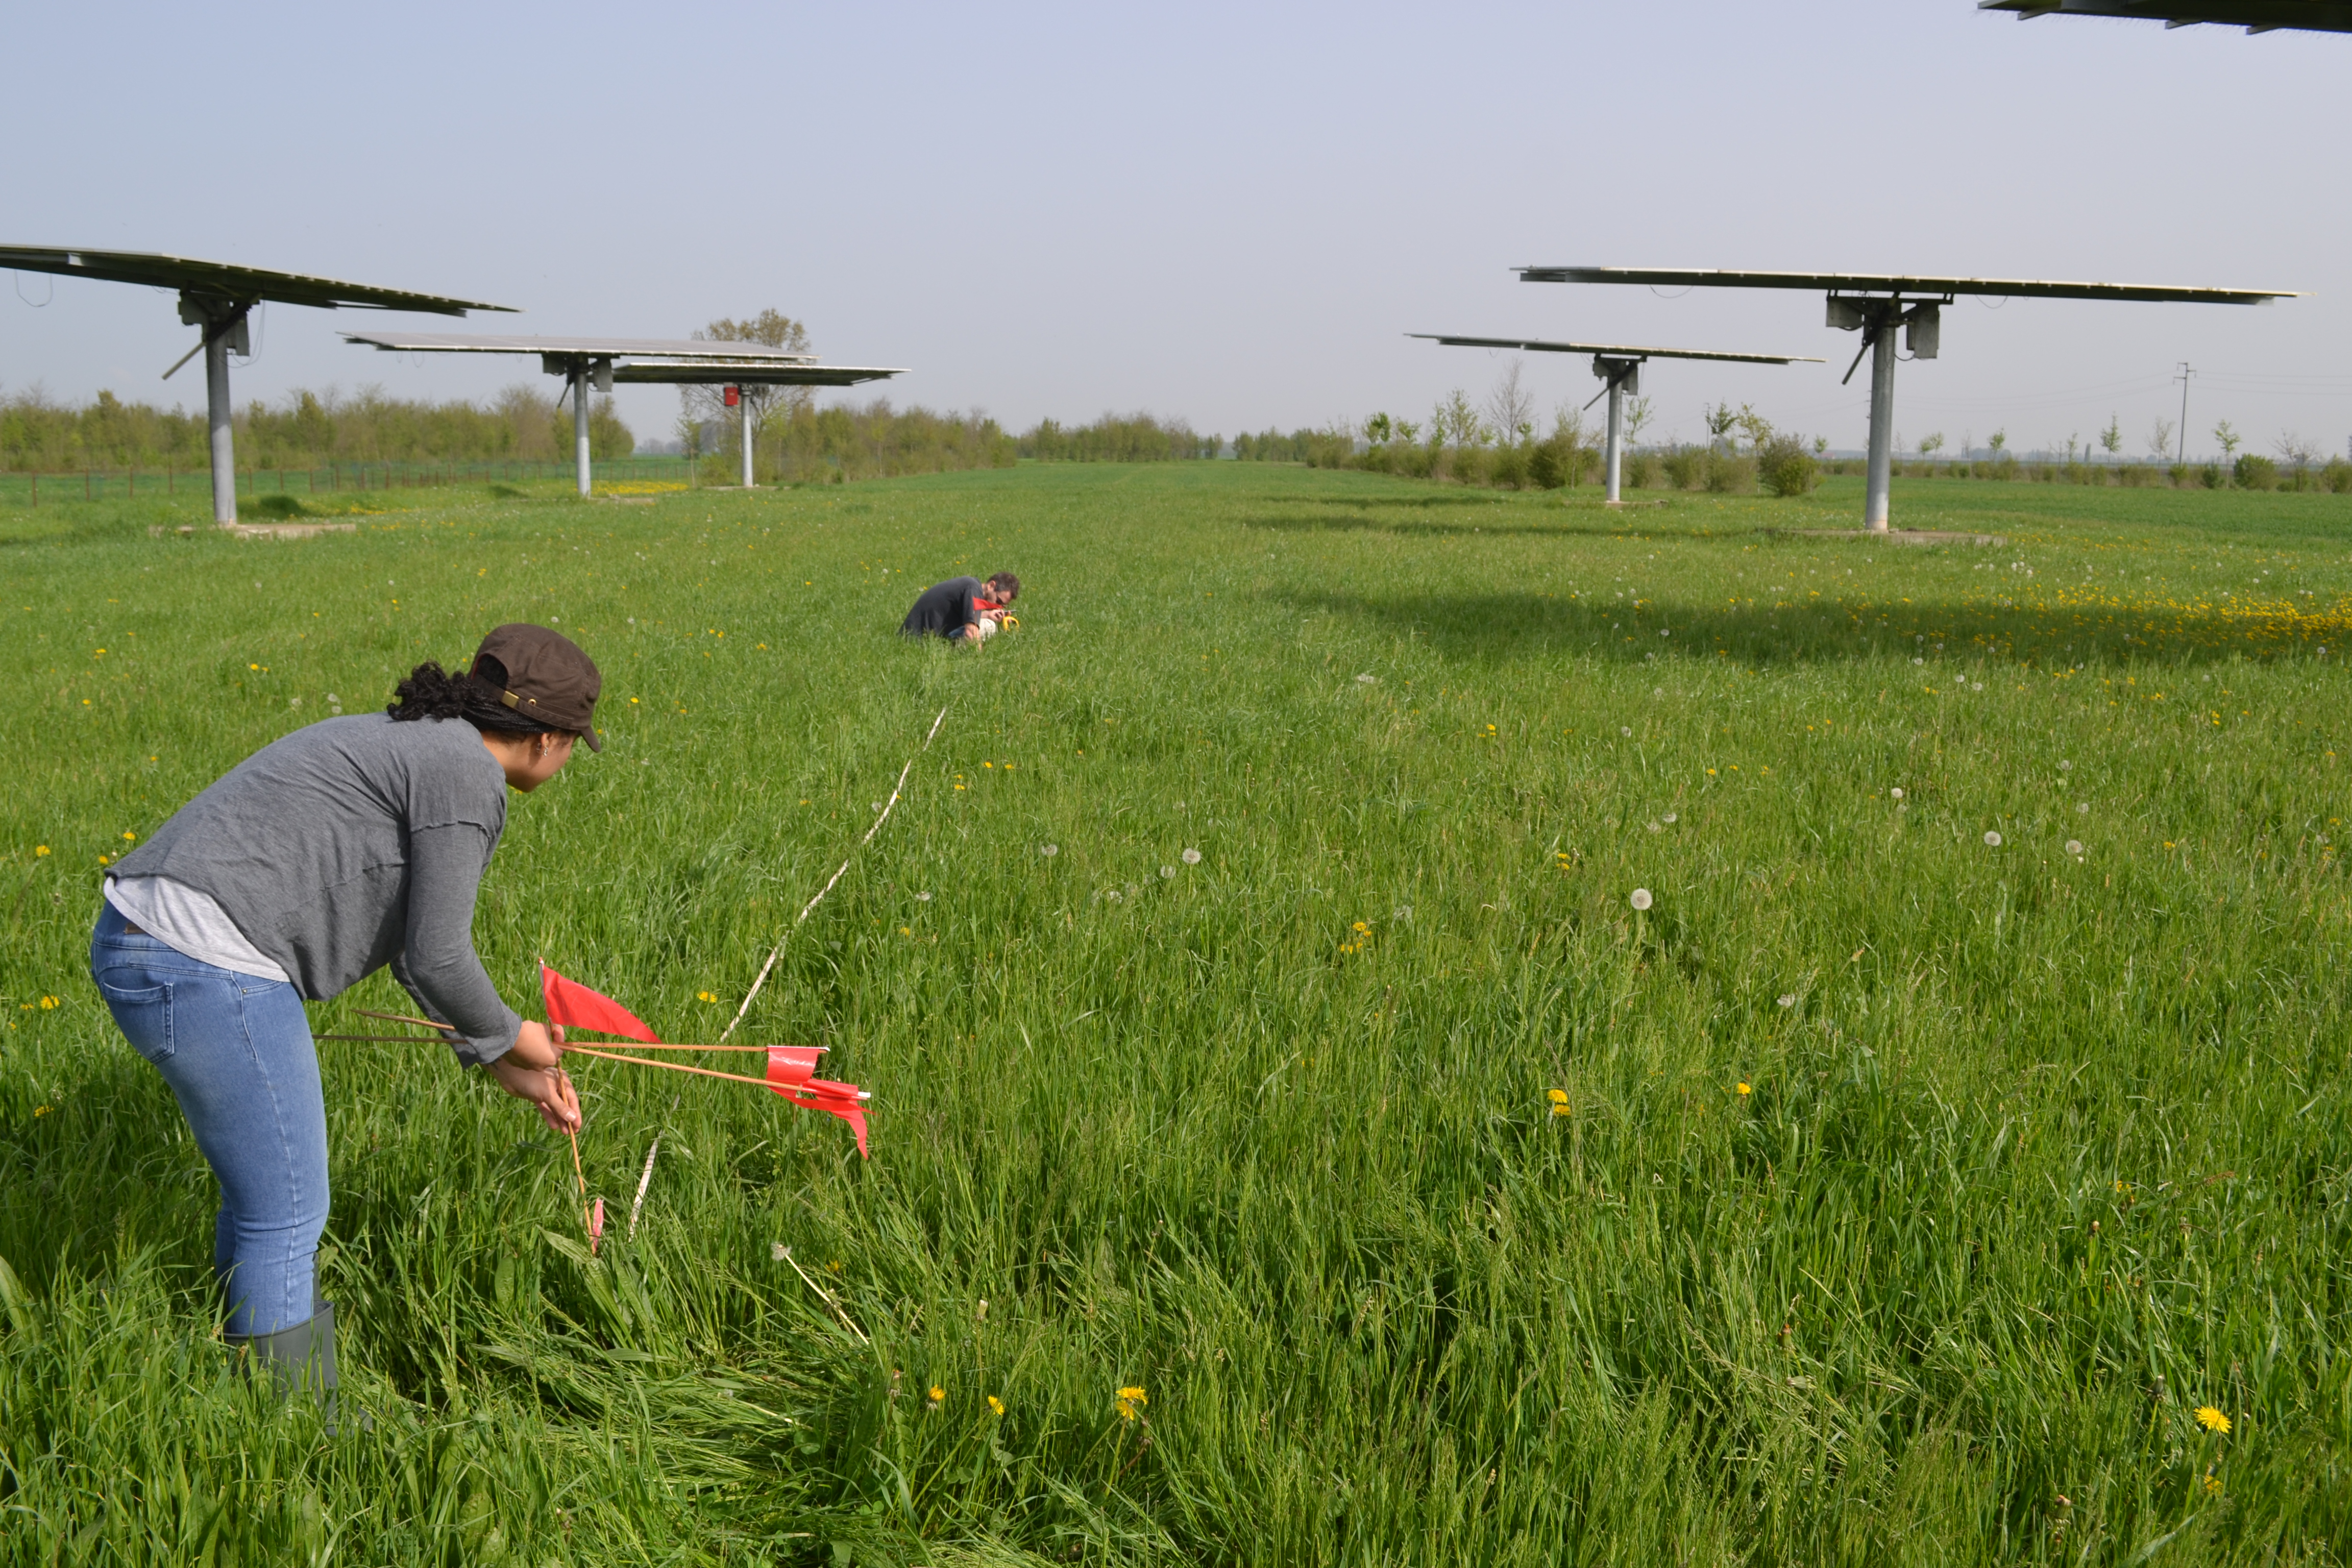
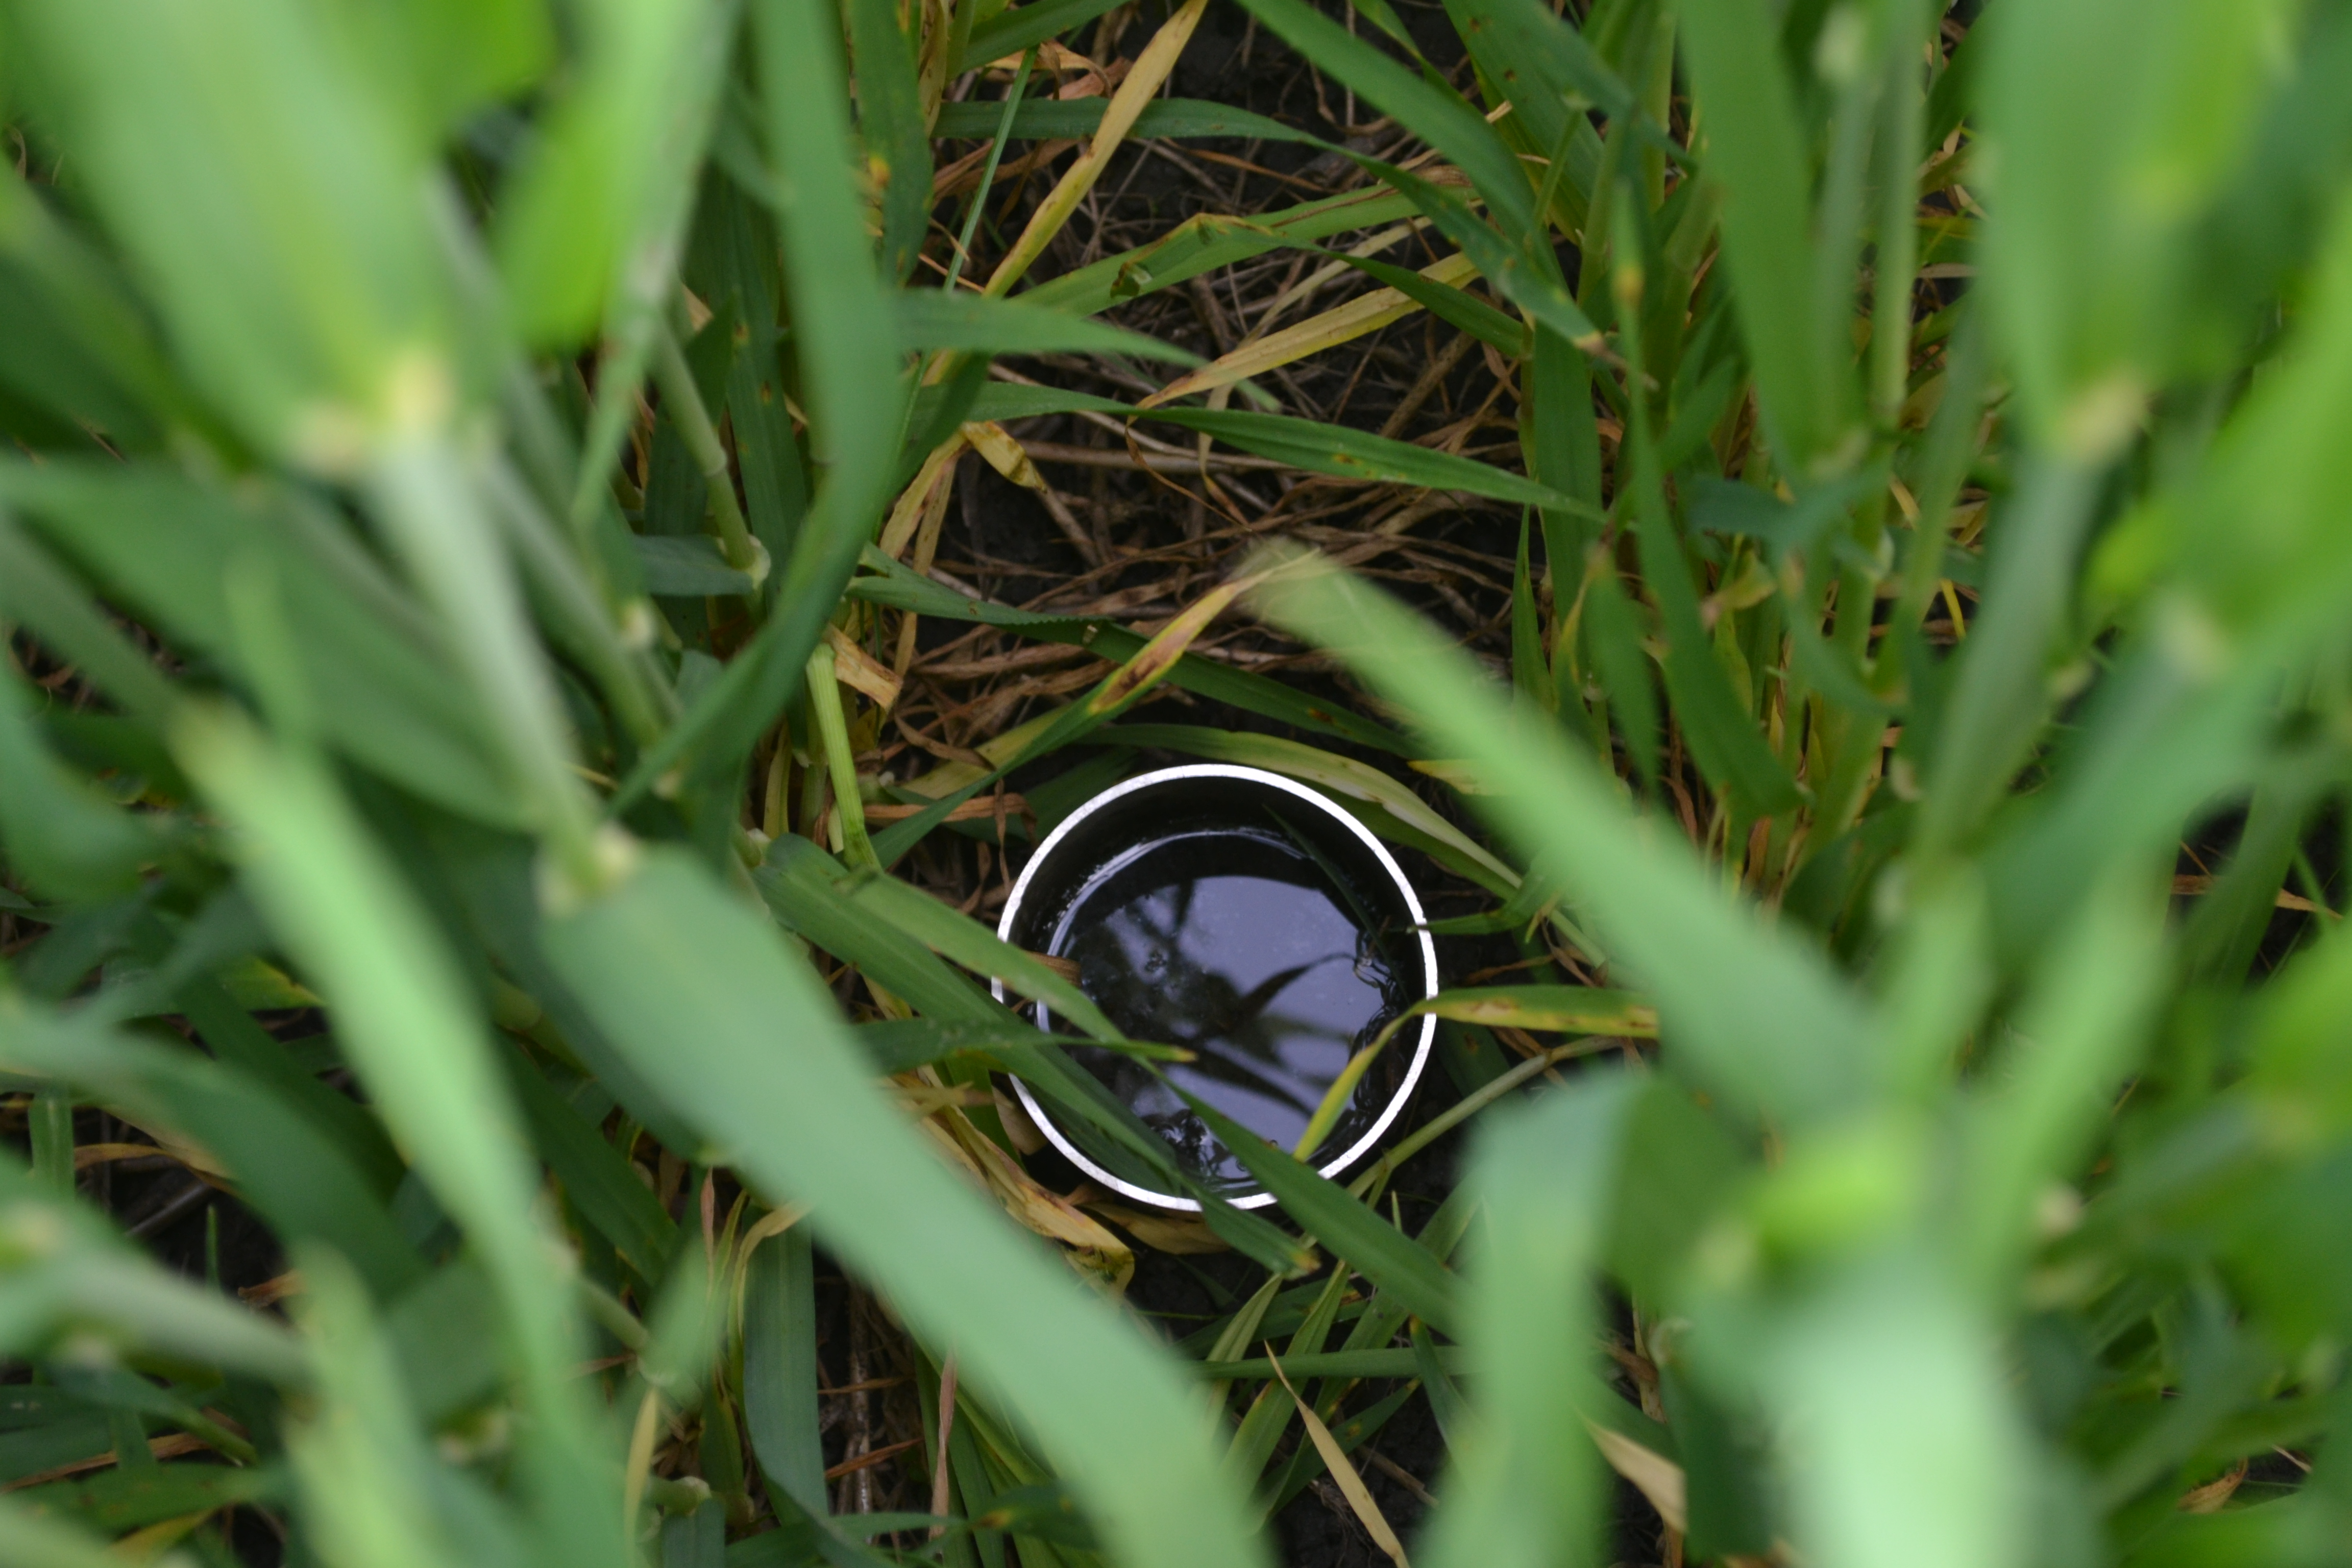
10×10 sqm
|
Infiltration capacity
|
The field campaign for the testing phase involved the following countries:
| Country | Partner supporting | Period |
|---|---|---|
| Austria | AGES | May 2018 |
| Belgium | ULIEGE | May 2018 |
| Denmark | UCPH | May-June 2018 |
| France | INRA , UNILASALLE , Conservatoire d’espaces naturels Normandie Seine | May 2018 |
| Germany | CALS | June 2018 |
| Hungary | SZIU | April 2018 |
| Ireland | TEAGASC | June 2018 |
| Italy : Emilia-Romagna Region, Mantova Province, Alto Adige Province and Veneto Region. | UNIPARMA | April – May 2018 |
| Romania | CLUJ-NAPOCA | April – May 2018 |
| Spain | Agro-Igualda , Pirenaica Cooperative | April 2018 |
| Sweden | SLU | May 2018 |
| Switzerland | FIBL | May 2018 |
| The Netherlands | RIVM | May 2018 |
Map of the 94 sampled sites
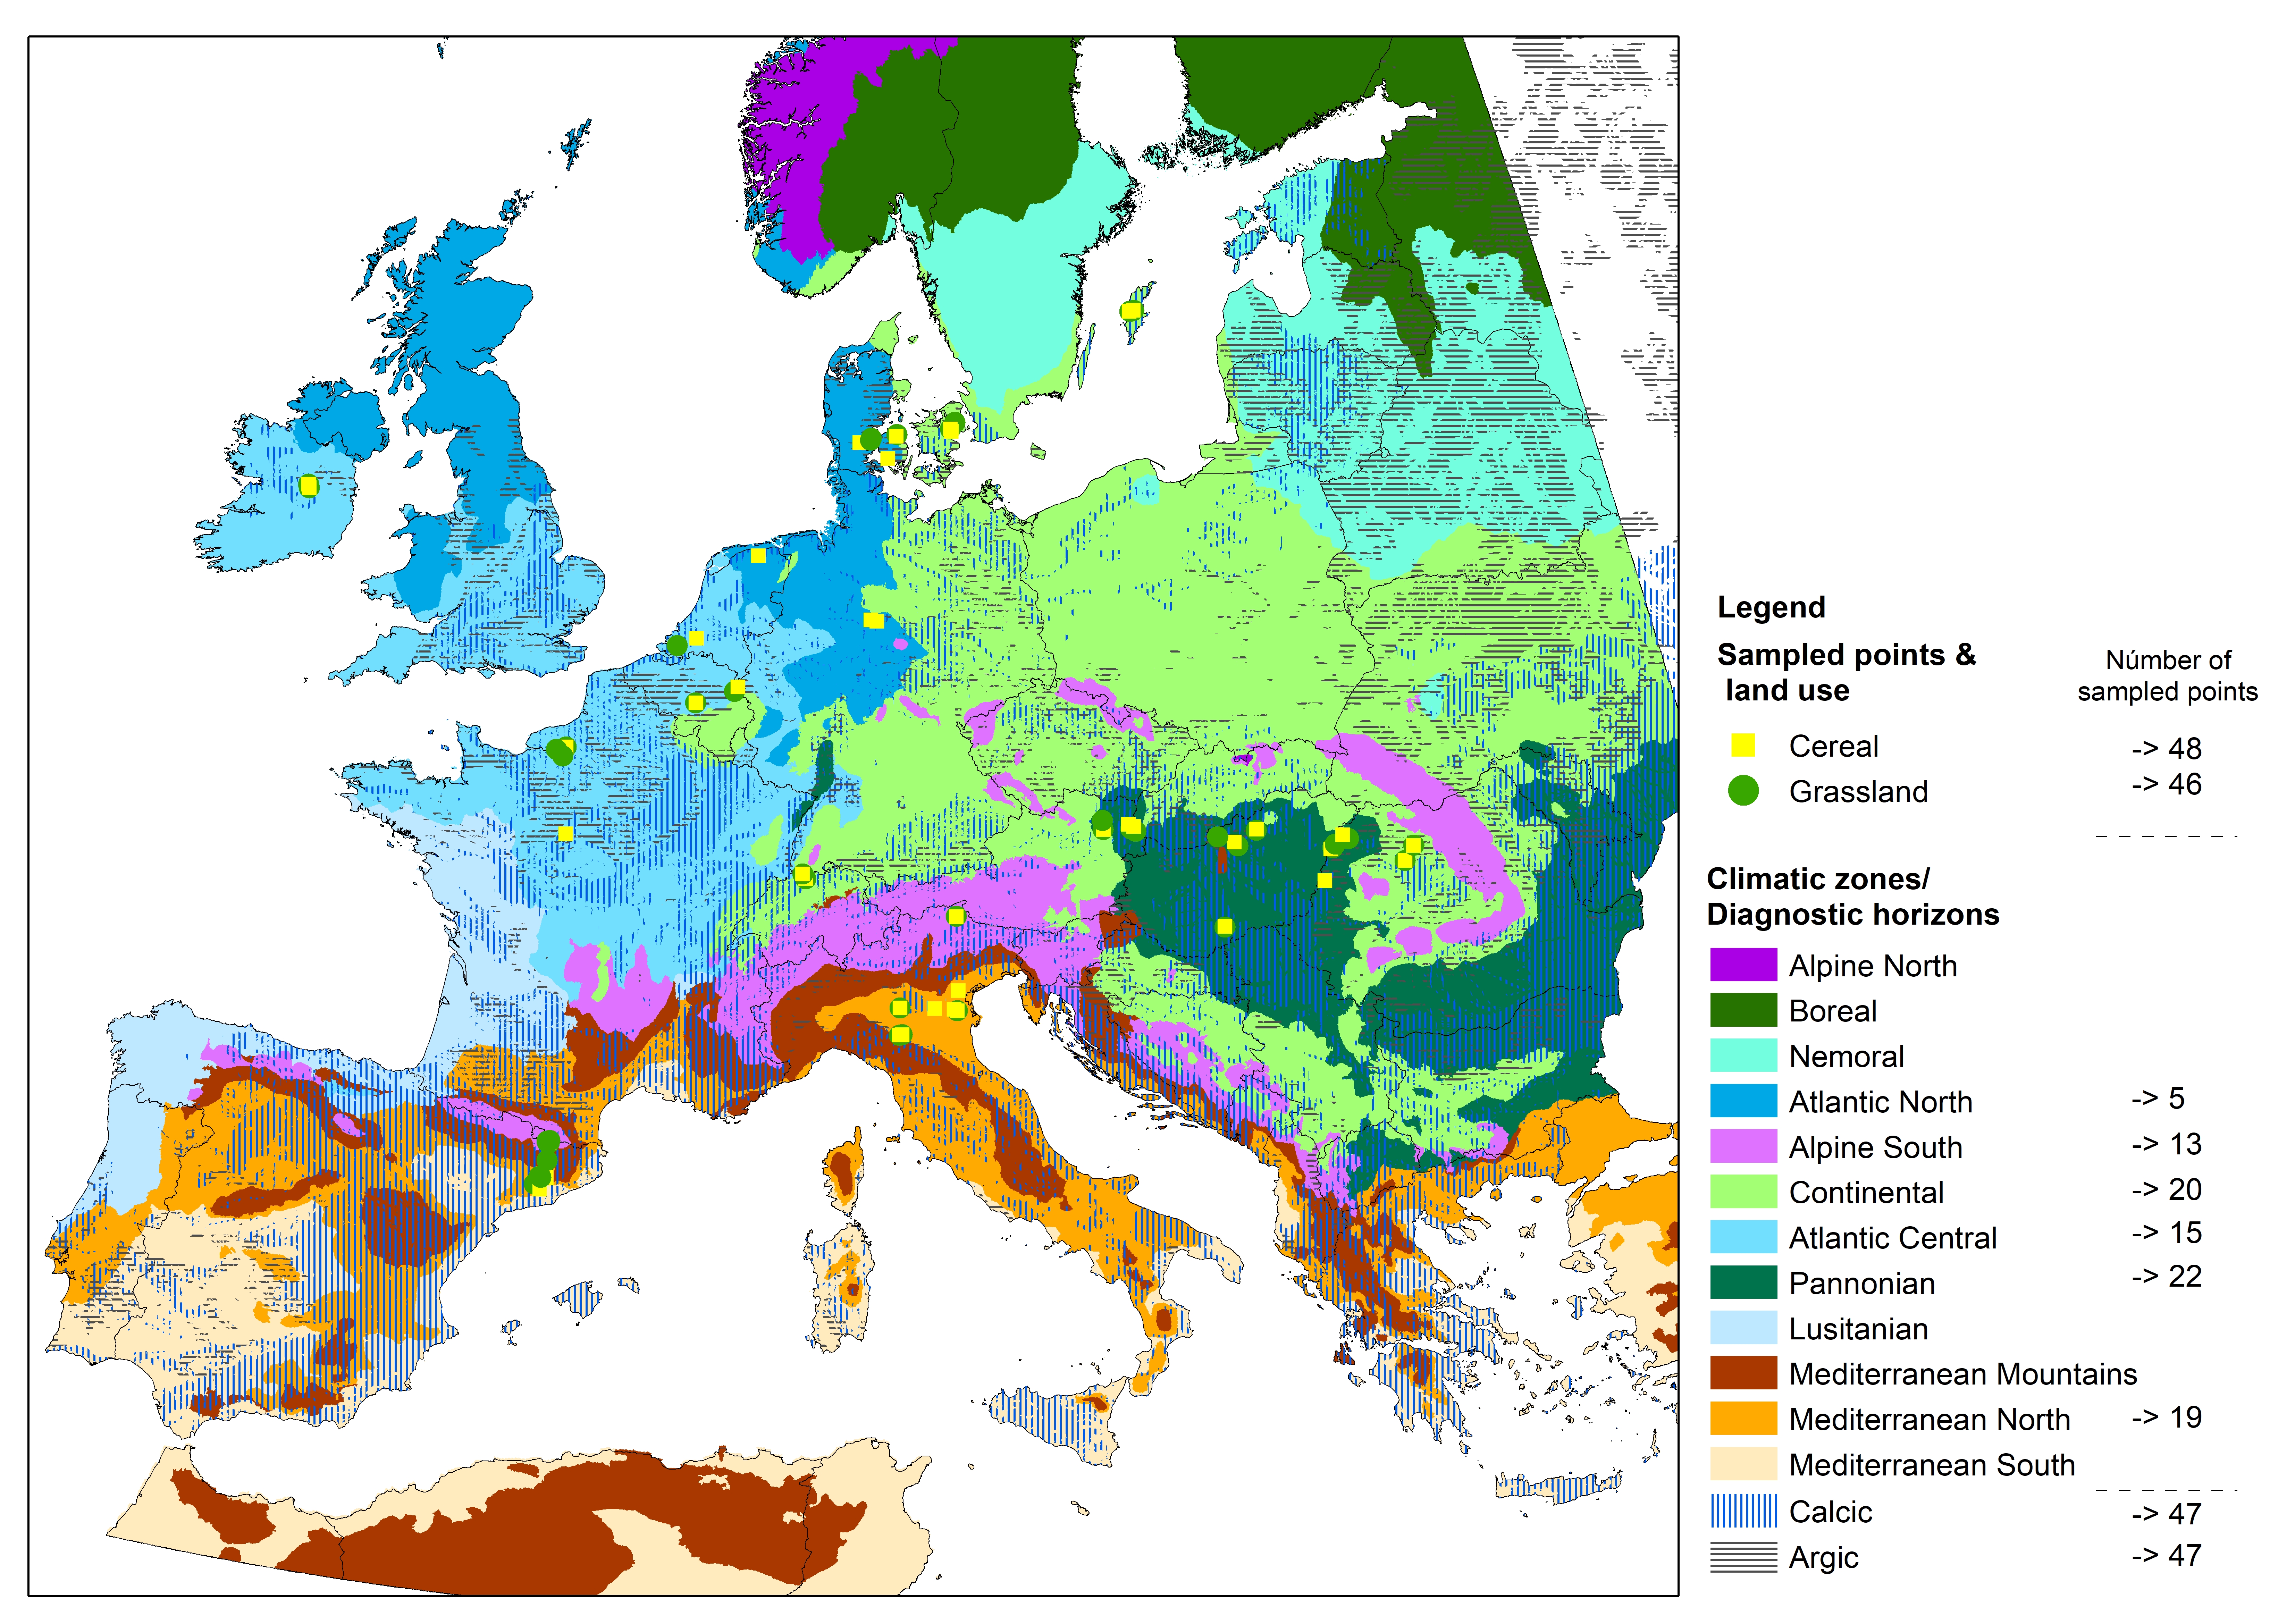
Figure 2. Map describing the number of sampled points per: land use, climatic zone and diagnostic horizon.
Results:
- Monitoring schema for regional and European application, testing of discrimination of indicators identified in WP3 delivered the23rd of October 2019 at the LANDMARK final policy conference in Bruxelles, Belgium.